6 Essential Metrics to Boost Your Business Performance
Success today requires more than great products — it demands data-driven decisions. Tracking key business metrics helps owners spot trends, optimise resources, and make smarter moves on pricing, promotions, and operations.

Running a small business today, whether a boutique, cafe, or restaurant, requires more than good products and friendly service. To stay competitive, business owners need to make data-driven decisions by tracking key performance metrics that reveal how well their business is performing, where profit potential is overlooked, and how customer behaviour is changing.
Understanding these numbers ensures business owners can identify trends early, optimise inventory and resources, and empower smarter decisions about pricing, promotions, and operations.
Why Growing Businesses Must Track Metrics Now
- Small businesses in Singapore are facing rising pressures. Reuters reports F&B (Food and Beverage) closures have increased from 254 monthly in 2024 to 307 in 2025, driven by higher costs and operational challenges. Beyond F&B, businesses in other sectors are also dealing with soaring rents and tighter margins.
- Yet there's still opportunity—63% of Singapore's small businesses now generate over 10% of revenue from online sales—a 36% jump since 2019 (2024-25 Asia-Pacific Small Business Survey). The businesses thriving in this environment are those tracking the right metrics and making data-driven decisions.

Measure What Matters: 6 Metrics That Drive Growth
To run a successful business, you need more than entrepreneurial acumen alone. You need data that shows what’s really driving performance.
From space utilisation and profit margins to customer loyalty and conversion rates, these six key metrics offer a clear picture of how your business is performing and where untapped opportunities exist.
Tracking important metrics regularly helps you make smarter decisions, manage costs, and strengthen your business’s long-term growth.
1. Sales per Square Foot (or Revenue per Seat for F&B businesses)
The sales per square foot or revenue per seat measures how efficiently you use your retail or restaurant space. Understanding this metric helps business owners make informed decisions about their merchandise display, product mix, and store or restaurant layout.
Sales per square foot is also insightful for analysing staff performance. Tracking sales per foot across different time slots or outlets helps you identify patterns. For example, a pattern of higher sales per square foot during specific shifts can indicate that the staff working during those times are more experienced or proactive in upselling.
Global data from Toast shows that full-service restaurants generate around US$150 in annual sales per square foot on average. Limited service and fast-casual restaurants average about US$200 and US$500 respectively.
According to Shopify, retail sales per square foot for small businesses typically range from US $300 to US $600. Reporting on the local market, The Edge Singapore notes that performance can vary by location, with centrally located retail shopfronts generally achieving higher sales per square foot than those in suburban areas.
| How to calculate sales per square foot | |
| Retail | Total Sales ÷ Total Square Feet |
| F&B | Total Sales ÷ Number of Seats |
Why sales per square foot matters.
High sales per square foot figures could indicate that a business’ layout, menu or product variety, and customer flow are performing well.
How to improve sales per square foot.
- Tracking the sales per square foot on a monthly basis is an ideal frequency for most growing businesses, as this frequency unlocks insights to even out daily fluctuations, and ensures data is recent enough to act on and make an impact on your bottomline. Businesses should monitor this metric for month-on-month growth or decline, and to assess the impact of layout changes, marketing promotions, and holidays.
- Every quarter, set aside time to review general trends in your sales per square foot to compare performance across different periods, and evaluate how efficiently you’re using retail or restaurant space in the long run.
2. Gross Profit Margin
The gross profit margin indicates how much businesses earn after subtracting the cost of goods sold (COGS)—whether it’s merchandise, ingredients, or packaging.
Singapore data from Devise shows that F&B businesses typically achieve gross profit margins of around 60% to 70%, while retail businesses average between 30% and 50%.
| How to calculate gross profit margin |
| (Revenue – COGS) ÷ Revenue × 100 |
Why COGS matters.
A business’s gross profit margin reflects its true profitability. Decreasing margins may indicate underlying issues, such as rising supplier costs, increased competition, poor pricing control, changes in product mix, or operational inefficiencies.
COGS action steps for small businesses.
- To improve gross profit margin, your business must prioritise increasing sales and reducing expenses:
- Educate your staff on how to upsell and cross-sell strategically by conducting mini-workshops for employees and sourcing information from online resources like TouchBistro, eduMe, and Coursera.
- Review and refine your product mix or menu regularly. Focus on high-performing items, and phase out products that take up space but are slow to sell.
- Leverage technology for real-time insights. Adopting smart POS (Point of Sale) systems like EPOS provide real-time visibility, giving business owners the data they need to act quickly.
- Given rising pressures for F&B businesses, managing and reducing food costs is key for improving gross profit margins. Businesses can achieve this by standardising recipes and using measuring tools for greater consistency, auditing kitchen prep, tracking food wastage, and offering daily menu specials.
3. Inventory Turnover Rate
The inventory turnover rate reveals how quickly businesses sell and restock products or go through ingredients.
According to CSIMarket data on U.S. companies, retail businesses report an average inventory turnover of about 10.9 times per year. For F&B businesses, data from Restroworks suggests a healthy turnover rate typically falls between three and six times per month, depending on factors like the type of establishment, perishability, and supply cycle.
| How to calculate inventory turnover rate |
| COGS ÷ Average Inventory |
Why inventory turnover matters.
Inventory turnover rate helps businesses understand how well they manage their inventory, and turn it into sales. A high turnover rate can indicate robust sales, effective stock management, and a healthy cash flow. If your business has a low inventory turnover rate, it may signal overstocking, low customer demand, or inefficient supply chain management.
How to improve your inventory turnover rate.
To improve your business’ inventory turnover rate, work on:
- Strengthening supplier relationships. When you build strong working relationships with suppliers, they’re more likely to grant favourable terms like offering flexible order sizes, faster delivery, or returns for unsold stock. This helps goods move faster, which increases the rate at which inventory is sold and replaced.
- Offering product bundling deals to increase purchase sizes and move inventory faster—pair complementary items, offer mix-and-match discounts, or set up displays that suggest complete outfits or meal combinations.

4. Customer Retention Rate
The customer retention rate measures how well businesses keep customers returning over time.
| How to calculate customer retention rate |
| [(Customers at End of Period – New Customers) ÷ Customers at Start of Period] × 100 |
Why customer retention rate matters.
Retaining existing customers costs less than acquiring new ones, and loyal customers spend more per visit.
Steps to strengthen your customer retention rate.
- Consider smart systems to create personalised customer experiences. According to McKinsey’s Next in Personalisation 2021 report, businesses that excel at creating personalised customer experiences generate 40% more revenue from these activities. Personalising your products, services, content, and customer experiences effectively requires the collection and analysis of data—this becomes easier with smart POS or booking management systems.
- Use a smart POS system like EPOS to capture purchase data from your customers, enabling businesses to implement targeted marketing based on individual preferences.
- Leverage intelligent CRM (Customer Relationship Management) solutions. Tools like Inline allow restaurant owners to send customised questionnaires to diners during or after their visits.
- Every reservation then becomes an opportunity to understand your customers, and gather valuable data like dietary requirements, visit frequency, and personal preferences. These insights help business owners tailor marketing, menu planning, and customer service strategies.
5. Average Transaction Value
The average transaction value shows how much each customer spends on average per visit.
| How to calculate average transaction value |
| Total Revenue ÷ Number of Transactions |
Why average transaction value matters.
A higher average transaction value boosts revenue without increasing foot traffic. This is important for small businesses, as the costs of attracting new customers—through marketing, delivery commissions, or promotions—cuts into margins. By increasing their average transaction value, businesses can grow revenue without needing to acquire more visitors.
Tips for small businesses.
- Draw attention to high-margin items. Feature high-margin products prominently, placing these products at eye level, using visual cues and enticing descriptions in store displays or menus, and training staff members to guide customers towards these products.
- Offer tiered pricing for goods and menu items. Strategic pricing strategies help increase the perceived value of your products and services, and encourage higher spending. Restaurant and cafe businesses can implement tiered pricing through set menu deals, happy hour promotions, or volume-based pricing (by offering beverages in small, medium, and large sizes, guiding customers towards mid- or high-tier options, and similar personalised approaches.
6. Foot Traffic to Conversion Rate
The foot traffic to conversion rate compares visitors versus paying customers. According to Retail TouchPoints, physical retail stores typically see conversion rates ranging between 20% and 40%. This can serve as a useful reference point for small retail and F&B operators assessing their own performance.
| How to calculate foot traffic to conversion rate |
| (Number of Sales ÷ Total Visitors) × 100 |
Why foot traffic to conversion rate matters.
Having a high volume of foot traffic doesn’t directly translate into more sales. If your business attracts many visitors but has a low conversion rate, this signals issues in your customer journey, like product mix, customer service, or pricing, that must be addressed.
Boosting foot traffic for growing businesses.
- Collect customer feedback through multiple channels, including surveys, social media listening, online reviews, and in-person conversations to identify pain points in the customer journey, and take steps to drive conversions and enhance customer satisfaction.
Using Metrics to Turn Data into Opportunity
Tracking these six key metrics gives small business owners a clear view of how well their operations are performing, beyond daily sales figures. By reviewing these metrics regularly, owners can uncover hidden inefficiencies, make sharper pricing and purchasing decisions, and build a more resilient and sustainably profitable business.
To get started, explore how smart solutions like EPOS and Inline can transform how you collect data, generate real-time insights, and streamline operational workflows.
Book a demo for Inline or learn more about EPOS to see how data-driven tracking can transform your business performance.
Related Articles

Singapore Small Business’s Guide to Tracking Footfall and Conversion Rates
With walk-in traffic declining across Singapore, tracking footfall is now crucial for F&B and retail success. Affordable footfall solutions help businesses uncover insights, boost performance, and make smarter growth decisions.

How to Turn First-Time Visitors into Regulars: A Strategic Guide for Singapore Businesses
In Singapore’s competitive market, retaining customers is far more cost-effective than acquiring new ones. Even a 5% boost in retention can lift profits by up to 95%, making loyalty the key to sustainable growth.

Boosting Supplier Resilience: A Practical Guide for Small Businesses in Singapore
Strong supplier relationships are vital for smooth operations and healthy profit margins. Learn how effective supplier management can help small retailers and F&B businesses in Singapore ensure consistency, quality, and growth.
Accelerate Your Business

All-in Business 5G+ SIM Only Plan
Made Easy and Secure
Keep connected to your business in SG and overseas securely with roaming data & mobile protect.


Customer Engagement
Made Easy
Engage and identify your best and most profitable customers to boost retention.

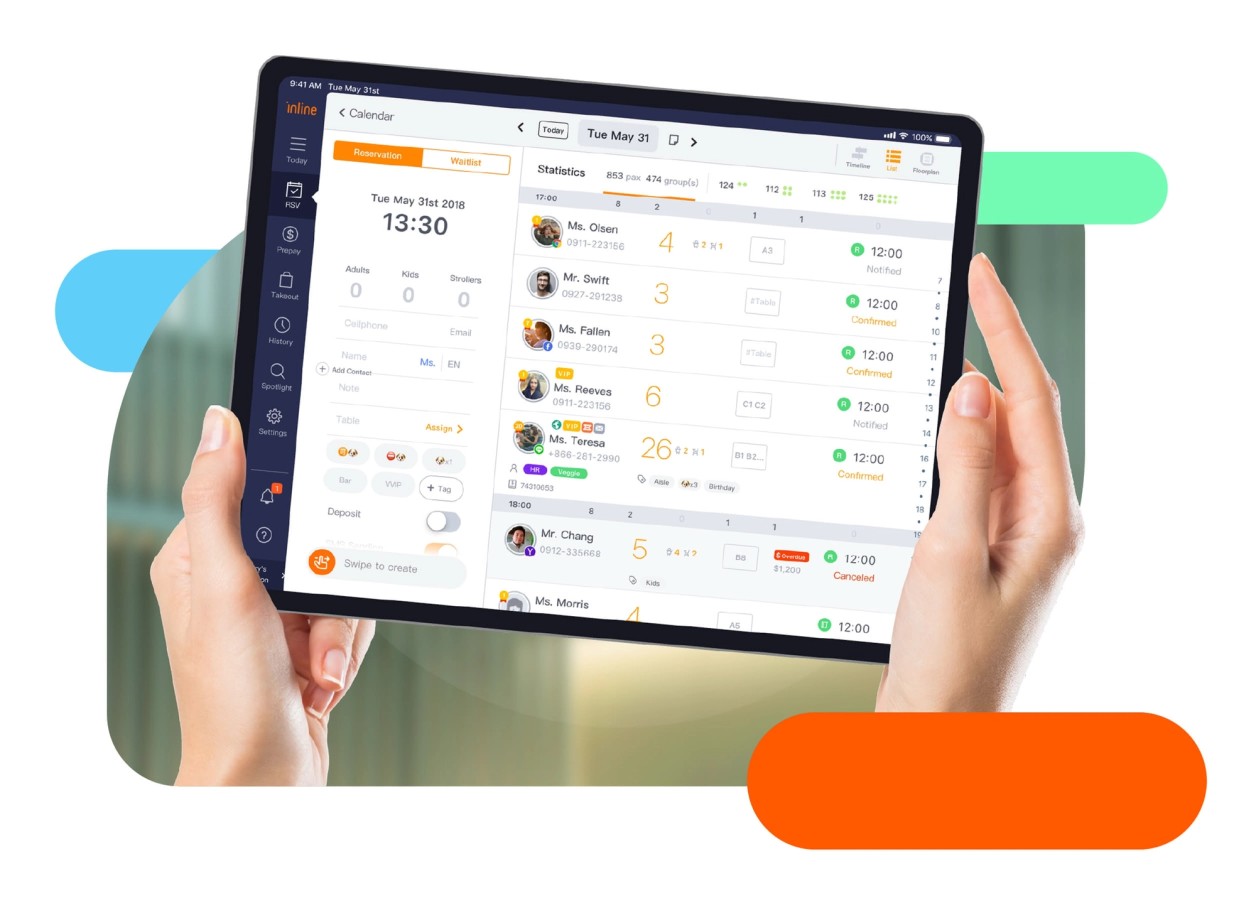
Table Management
Made Easy
From first click to final bill, manage bookings, tables, and guests with ease.
